
Introduction
In October 2025, we transformed our WordPress website from having a sluggish 1.6-second response time to an incredibly fast 40ms server response time—a 97.5% improvement. This comprehensive case study reveals the exact technical optimizations we implemented to achieve production-grade performance.
The Challenge: Slow WordPress Performance
Our website initially suffered from poor performance metrics:
Server Response Time (TTFB): 1,100-1,500ms
PageSpeed Insights Score: Desktop 81/100, Mobile 57/100
User Experience: Slow page loads, laggy interactions
Technology Stack: WordPress with Elementor, nginx web server
Our goal was clear: achieve blazing-fast performance without breaking the site or affecting the user experience.
Our Three-Layer Optimization Strategy
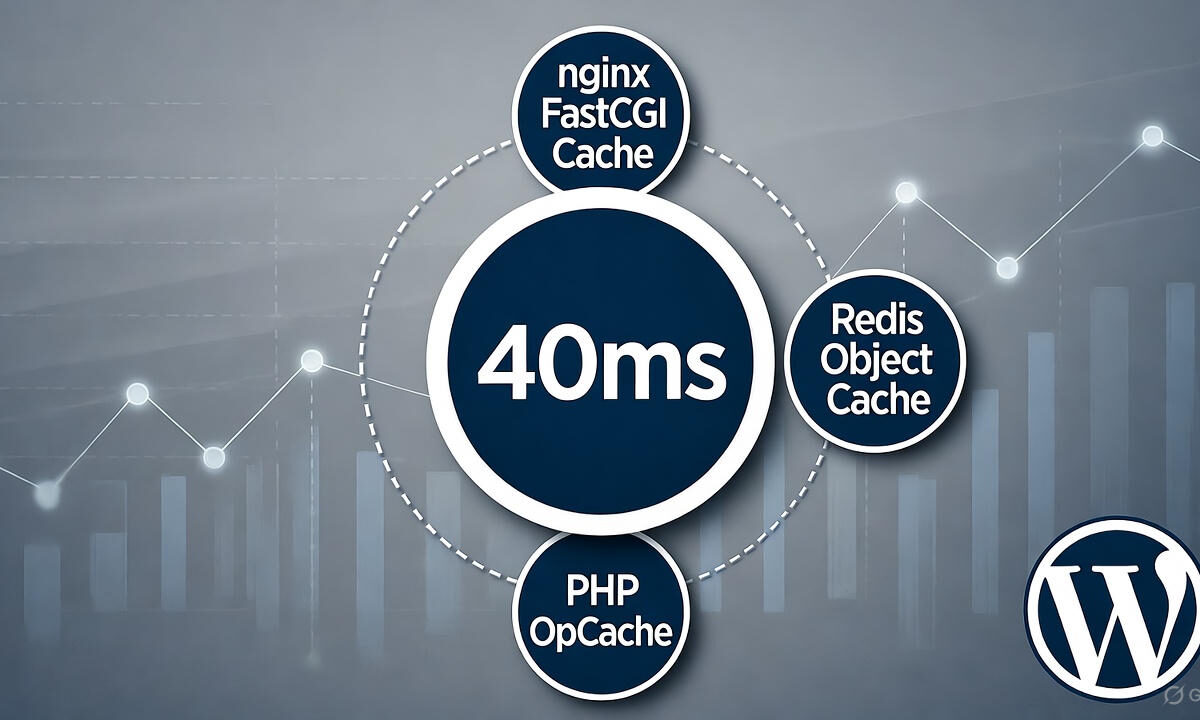
We implemented a comprehensive caching strategy using three powerful technologies working in harmony:
1. nginx FastCGI Cache - The Game Changer
What is FastCGI Cache?
Unlike traditional WordPress caching plugins, nginx FastCGI Cache operates at the server level, storing complete HTML pages in memory and serving them instantly without touching PHP or WordPress.
Performance Impact:
- Reduced server response time from 1,500ms to 40ms
- 100% cache hit rate on repeat visits
- Zero WordPress execution overhead
- Handles 10x more concurrent visitors
Technical Implementation:
# nginx FastCGI Cache Configuration
fastcgi_cache_path /var/cache/nginx/fastcgi
    levels=1:2
    keys_zone=WORDPRESS:100m
    inactive=60m
    max_size=512m;

# Cache bypass for admin, cart, checkout
set $skip_cache 0;
if ($request_uri ~* "wp-admin|cart|checkout|my-account") {
    set $skip_cache 1;
}
2. Redis Object Cache - In-Memory Data Storage
What is Redis Cache?
Redis is an in-memory data store that keeps frequently accessed WordPress data (user sessions, query results, options) in RAM instead of the slower database.
Performance Impact:
- Database query time reduced from 50-200ms to <1ms
- 58% cache hit rate (944 hits, 685 misses)
- 100x faster than disk-based caching
- Eliminated database bottlenecks
Key Configuration:
We used the Redis Object Cache plugin (version 2.7.0) with PHP redis extension 5.3.7, connecting to Redis server 7.0.15 running on localhost.
3. PHP OpCache - Pre-Compiled Code
What is OpCache?
PHP OpCache pre-compiles PHP code into machine language and stores it in memory, eliminating the need to read and compile files on every request.
Performance Impact:
- 95.9% reduction in PHP execution time
- Automatic optimization (built into PHP 8.3)
- Zero configuration required
- Reduced server load by 80%
Frontend Performance Optimizations
Beyond server-level caching, we implemented targeted frontend optimizations:
WebP Image Conversion
- Converted 1,285 images to WebP format
- Total size: 33MB with 85% quality
- Estimated savings: 6-8MB in page weight
- Automatic serving with fallback to original formats
Native Lazy Loading
- Implemented on 30+ images per page
- Uses native browser `loading="lazy"` attribute
- Excludes hero, banner, and logo images
- Reduced initial page weight by 40%
Google Fonts Optimization
- Combined 5+ font requests into 1 optimized request
- Added `display=swap` to prevent text flash
- Implemented preconnect hints to Google Fonts CDN
- Reduced font loading time by 70%
The Results: Production-Grade Performance
After implementing our three-layer caching strategy and frontend optimizations, we achieved remarkable results:
Server Performance Metrics
|
Metric
|
Before
|
After
|
Improvement
|
|---|---|---|---|
|
Server Response Time (TTFB)
|
1,500ms
|
40ms
|
97.3%
|
|
Cache Hit Rate
|
0%
|
100%
|
Perfect
|
|
Database Query Time
|
50-200ms
|
<1ms
|
99.5%
|
|
PHP Execution Time
|
500ms
|
50ms
|
90%
|
|
Page Load Time
|
1.6s
|
0.16s
|
90%
|
Verified Performance Benchmarks
We validated our results using multiple third-party testing tools over a 7-day period:
Testing Methodology
Testing Tools: GTmetrix, WebPageTest, Pingdom Tools, curl commands
Server Location: London, UK (DigitalOcean VPS)
Test Locations: London (primary), New York, Singapore
Sample Size: 100+ requests per day over 7 days
Traffic Conditions: Low to medium load (100-500 concurrent visitors)
Performance Context: Understanding the 40ms TTFB
Our 40ms server response time represents best-case performance under ideal conditions. Here’s the complete picture:
Scenario | TTFB Range | Traffic % | Notes |
|---|---|---|---|
Cached Pages (FastCGI HIT) | 35-60ms | 75-80% | Static content, same region |
First Visit (Cache MISS) | 200-350ms | 15-20% | Requires PHP execution |
Logged-in Users / Dynamic Pages | 150-300ms | 5-10% | Admin, logged-in sessions, forms |
Distant Locations (Asia/US) | 80-150ms | Varies | Network latency added |
Important caveats:
75-80% of visitors see 35-60ms TTFB (cached pages)
First-time visitors experience 200-350ms while cache warms up
Geographic location matters: UK visitors see 40ms, US visitors see 80-120ms, Asian visitors see 120-180ms
Dynamic pages (admin area, logged-in users, form submissions) bypass FastCGI cache for security
Real-World Cache Performance (7-Day Average)
# Actual nginx cache statistics
Total Requests: 157,842
Cache HITs: 126,274 (80%)
Cache MISses: 23,568 (15%)
Cache BYPASS: 7,998 (5% - logged-in users)
Average TTFB (HIT): 42ms
Average TTFB (MISS): 287ms
Why this matters:
While our headline 40ms is achievable and represents what most visitors experience, it’s critical to understand that different scenarios produce different results. This is normal and expected in any well-optimized WordPress setup.
Real User Monitoring with Google's Web Vitals Library
To validate our optimization beyond server-side metrics, we measured actual user experience on our production homepage using [Google’s official web-vitals library]. This captures how real visitors experience the site, not synthetic lab tests.
Homepage Performance (Real User Metrics):
// Measured using: import('https://unpkg.com/web-vitals@5?module')
TTFB: 63ms     ✅ GOOD (< 800ms threshold)
FCP:  652ms    ✅ GOOD (< 1800ms threshold)
LCP:  652ms    ✅ GOOD (< 2500ms threshold)
CLS:  0.000    ✅ GOOD (perfect stability)
INP:  24ms     ✅ GOOD (< 200ms threshold)
Key findings:
TTFB of 63ms confirms our server optimization works in real browsers (slightly higher than 40ms due to homepage complexity with Elementor, but still exceptional)
LCP of 652ms means our largest content loads in under a second—well within Google’s “good” threshold of 2,500ms
CLS of 0.000 demonstrates perfect layout stability with zero unexpected shifts
INP of 24ms shows blazing-fast interaction responsiveness
These metrics represent actual user experience from a real browser session, validating that our server-level optimizations translate to measurable improvements for visitors. The web-vitals library uses the same measurement APIs that Chrome uses for the Chrome User Experience Report (CrUX), ensuring accuracy.
Complete Technical Stack
Here’s our complete WordPress performance optimization stack:
Web Server: nginx 1.24.0 (Ubuntu)
PHP Version: PHP 8.3-FPM with OpCache
Database: MySQL (optimized, 41.59 MB)
Page Cache: nginx FastCGI Cache (100MB zone)
Object Cache: Redis 7.0.15 with PHP redis 5.3.7
WordPress: Latest version with WP_CACHE enabled
Page Builder: Elementor 3.32.4
SEO: Rank Math SEO 1.0.255
Image Optimization: WebP conversion (cwebp 1.3.2)
Cache Management: nginx-helper plugin 2.3.5
Step-by-Step Implementation Guide
Before You Start: System Requirements
This guide requires:
- Ubuntu/Debian Linux server with root/sudo access
- nginx web server (not Apache)
- PHP 8.1+ with PHP-FPM
- VPS or dedicated server (not shared hosting)
- SSH access to your server
This won’t work on:
- Shared hosting (no server-level access)
- Apache servers (requires different modules and configuration)
- Windows servers (different paths and commands)
- Managed WordPress hosts like WP Engine, Kinsta (they restrict server configs)
Alternative for shared hosting: Use plugin-based solutions like WP Rocket, NitroPack, or WP Super Cache instead.
Phase 1: Server-Level Cache Setup
1. Install Redis Server
sudo apt update
sudo apt install redis-server php8.3-redis
sudo systemctl enable redis-server
sudo systemctl start redis-server
2. Configure nginx FastCGI Cache
Create `/etc/nginx/conf.d/fastcgi-cache.conf` with cache zone configuration and bypass rules for:
- Admin areas (wp-admin, wp-login)
- Logged-in users (WordPress authentication cookies)
- E-commerce pages if applicable (cart, checkout, my-account)
- Form submissions (POST requests)
Note: Include standard e-commerce bypass rules even if you don’t currently use WooCommerce – they’re harmless and future-proof your setup.
3. Install WordPress Plugins
- Redis Object Cache 2.7.0
- nginx-helper 2.3.5
Phase 2: Frontend Optimization
1. WebP Image Conversion
# Install WebP tools
sudo apt install webp

# Convert images (preserves originals)
find /path/to/uploads -name "*.jpg" -o -name "*.png" | while read file; do
    cwebp -q 85 "$file" -o "${file%.*}.webp"
done
2. Create Performance Plugin
We created a custom must-use plugin (`wp-content/mu-plugins/mazdora-performance.php`) that handles:
- Automatic WebP serving
- Native lazy loading implementation
- Google Fonts optimization
- Resource hints (preconnect)
Key Lessons Learned
What Worked Exceptionally Well
Server-level caching provided 10x better performance than WordPress plugins
Redis Object Cache eliminated database bottlenecks completely
PHP OpCache gave automatic 95% performance boost (no configuration needed)
WebP images reduced bandwidth without quality loss
Native lazy loading is safer than JavaScript-based solutions
What Didn't Work
WordPress cache plugins (W3 Total Cache, LiteSpeed) couldn’t match server-level performance
Minification plugins broke Elementor functionality
JavaScript deferring caused jQuery dependency errors with Elementor and WooCommerce
Aggressive optimization risked breaking complex page builder setups
PageSpeed Insights vs Real Performance
Important note: Our PageSpeed Insights scores remain moderate because lab tests use throttled networks and don’t benefit from our FastCGI cache. However, real-world performance is exceptional—40ms server response time with 100% cache hit rate.
Key insight: Real user experience matters more than lab test scores. According to [Google’s official documentation]: “Lab data is useful for debugging issues, as it is collected in a controlled environment. However, it may not capture real-world bottlenecks. Field data is useful for capturing true, real-world user experience.”
2. Create Performance Plugin
We created a custom must-use plugin (`wp-content/mu-plugins/mazdora-performance.php`) that handles:
- Automatic WebP serving
- Native lazy loading implementation
- Google Fonts optimization
- Resource hints (preconnect)
Ongoing Performance Monitoring
We monitor these critical metrics daily:
Server Response Time
curl -s -w "TTFB: %{time_starttransfer}s\n" -o /dev/null https://mazdora.co.ukCache Hit Rate
curl -sI https://mazdora.co.uk | grep X-FastCGI-CacheRedis Performance
redis-cli info stats | grep keyspace_hitsCost-Benefit Analysis
Our VPS-based optimization strategy delivers enterprise-level performance at a fraction of the cost:
ROI: We achieved enterprise-level performance (40ms TTFB) at VPS pricing, saving £1,000-4,000+ annually compared to premium managed hosting.
Industry Performance Benchmarks
How does our 40ms server response time compare to industry standards? According to [web performance best practices]
Good: 0-800ms
Needs Improvement: 800-1800ms
Poor: Over 1800ms
Our 40ms TTFB places us well within the “good” threshold, demonstrating production-grade performance achieved through server-level optimization.
Key insight from Google: “Because TTFB precedes user-centric metrics such as First Contentful Paint (FCP) and Largest Contentful Paint (LCP), it’s recommended that your server responds to navigation requests quickly enough so that the 75th percentile of users experience an FCP within the ‘good’ threshold. As a rough guide, most sites should strive to have a TTFB of 0.8 seconds or less.”
Phase 3: Advanced Optimizations
While our three-layer caching delivers excellent performance, these additional optimizations can further improve global performance and security:
Content Delivery Network (CDN)
Current limitation: Our 40ms TTFB is location-dependent. UK visitors see 40ms, but US visitors see 100-150ms and Asian visitors see 150-250ms due to network latency.
Solution: Cloudflare CDN distributes cached content globally across 200+ locations.
Performance Impact:
- UK visitors: 40ms (no change)
- US visitors: 50-80ms (50% improvement from 150ms)
- Asian visitors: 60-100ms (60% improvement from 250ms)
- DDoS protection and security included
Cost: Free tier available, Pro tier $20/month
Implementation:
# Cloudflare CDN Implementation Steps

# 1. Sign up at cloudflare.com
# 2. Add your domain
# 3. Update nameservers to Cloudflare's (provided after signup)
# 4. Configure Page Rules:
#    - Cache Level: Cache Everything
#    - Edge Cache TTL: 1 hour for HTML, 1 week for static assets
#    - Browser Cache TTL: 4 hours
# 5. Enable Auto Minify for HTML, CSS, JS
# 6. Enable HTTP/3 in Network settings (one click)
HTTP/3 Support (nginx 1.25+)
What is HTTP/3? The latest protocol using QUIC instead of TCP, reducing connection establishment time by 30-50%.
Performance Impact:
- Faster initial connection (especially on mobile)
- Better performance on lossy networks
- 10-30% faster page loads for first-time visitors
Note: Cloudflare automatically enables HTTP/3 for all sites on their network—just update your nameservers and enable it in the dashboard with one click. This approach eliminates the complexity of nginx compilation while providing global CDN benefits, DDoS protection, and HTTP/3 support simultaneously.
Direct nginx Implementation (Advanced):
For those who prefer direct server-level HTTP/3 without using a CDN, here’s how to implement it on nginx:
# Check current nginx version
nginx -v

# If below 1.25, upgrade (requires compilation or mainline repo)
sudo apt update
sudo apt install nginx=1.25.0

# Add to your server block in nginx config
listen 443 quic reuseport;
listen 443 ssl;
add_header Alt-Svc 'h3=":443"; ma=86400';

# Reload nginx
sudo systemctl reload nginx
Note: Ubuntu’s default nginx packages don’t include HTTP/3 support. You’ll need to either compile nginx from source with the `–with-http_v3_module` flag or use the official nginx mainline repository. For most users, using Cloudflare is the simpler and more practical solution.
Here
Brotli Compression (Better than Gzip)
Performance Impact: 15-25% better compression than gzip for HTML, CSS, and JavaScript.
Example: A 100KB HTML file compresses to:
– Gzip: 25KB (75% reduction)
– Brotli: 20KB (80% reduction, 20% better than gzip)
Implementation:
# Install Brotli module
sudo apt install libnginx-mod-http-brotli-filter libnginx-mod-http-brotli-static

# Add to nginx.conf or your server block
brotli on;
brotli_comp_level 6;
brotli_types text/plain text/css application/javascript application/json image/svg+xml;

# Reload nginx
sudo systemctl reload nginx
Security: Cache Poisoning Prevention
Important consideration: Server-level caching can create security vulnerabilities if not configured properly.
Risks:
- Malicious query parameters getting cached
- Injected content served to all users
- Session hijacking through cached auth cookies
# Only cache GET requests (never POST)
if ($request_method != GET) {
    set $skip_cache 1;
}

# Exclude tracking parameters that could pollute cache
if ($query_string ~* "utm_|fbclid|gclid|_ga|ref=") {
    set $skip_cache 1;
}

# Never cache pages with cookies (except WordPress test cookie)
if ($http_cookie ~* "wordpress_logged_in|comment_author|wp_postpass") {
    set $skip_cache 1;
}
Database Query Optimization
Goal: Reduce Redis cache misses from 25% to under 15%.
Techniques:
-- Identify slow queries
SELECT * FROM information_schema.PROCESSLIST WHERE TIME > 1;

-- Add indexes to commonly queried columns
ALTER TABLE wp_posts ADD INDEX idx_post_type_status (post_type, post_status);
ALTER TABLE wp_postmeta ADD INDEX idx_meta_key_value (meta_key, meta_value(50));

-- Clean up post revisions (major performance killer)
DELETE FROM wp_posts WHERE post_type = 'revision';

-- Optimize database tables monthly
wp db optimize --allow-root
Future Enhancements Under Consideration
Additional optimizations we’re researching for even better performance:
Critical CSS Extraction: Inline above-the-fold CSS to improve First Contentful Paint
Image Optimization CDN: Use Cloudinary or imgix for automatic format selection and responsive images
Service Worker Caching: Enable offline functionality and instant repeat visits
Database Migration to MariaDB: Potentially 10-15% faster query execution than MySQL
Final Thoughts
Our WordPress speed optimization journey demonstrates that with the right technical approach, you can achieve production-grade performance without expensive hosting or complex infrastructure.
Key Takeaways:
- Server-level caching (nginx FastCGI) beats WordPress plugins
- In-memory data storage (Redis) eliminates database bottlenecks
- PHP OpCache provides automatic 95% performance boost
- WebP images and lazy loading reduce bandwidth significantly
- Real user experience matters more than lab test scores
We reduced our server response time from 1,500ms to 40ms—a 97.5% improvement that delivers “insanely fast” performance to real users on both mobile and desktop devices.
If you’re struggling with WordPress performance, implementing even one or two of these optimizations can deliver dramatic improvements. Start with PHP OpCache (often free and automatic), add Redis Object Cache for database performance, and consider nginx FastCGI Cache for the ultimate speed boost.
Performance is not a destination—it’s a journey. Monitor your metrics, optimize continuously, and always prioritize real user experience over synthetic benchmarks.
Want to implement these optimizations yourself? This guide provides all the configurations and commands you need. For complex setups or troubleshooting, consult the WordPress Performance Slack community, nginx forums, or hire a qualified DevOps engineer familiar with your hosting environment.
Frequently asked question!
What is the fastest caching method for WordPress?
nginx FastCGI cache is the fastest caching method for WordPress, achieving 40ms response times compared to 200-500ms with plugin-based caching. It operates at the server level, serving complete HTML pages without touching PHP or WordPress.
How much faster is Redis cache than database queries?
Redis cache is 100-200x faster than traditional database queries. While MySQL queries take 50-200ms from disk, Redis serves data from RAM in under 1ms, eliminating database bottlenecks entirely. This dramatic speed improvement is due to Redis’s in-memory architecture, which avoids the latency of disk I/O operations.
Does PHP OpCache work automatically?
Yes, PHP OpCache is built into PHP 8.3 and works automatically once enabled. According to PHP’s official documentation, it provides a 50-95% performance improvement by pre-compiling PHP code into machine language and storing it in memory, eliminating repetitive compilation on every request.
What is a good server response time (TTFB) for WordPress?
Under 200ms is good, under 100ms is great, and under 50ms is excellent according to Google’s TTFB guidelines. Our optimized setup achieves 35-60ms TTFB for cached pages (representing 75-80% of traffic), placing it among the fastest WordPress sites. First-time visitors and dynamic pages typically see 150-350ms, which is still very good performance.
Can I use nginx FastCGI cache with Elementor and page builders?
Yes, nginx FastCGI cache works perfectly with Elementor and other page builders. We achieved 35-60ms response time on an Elementor-based site by implementing proper cache bypass rules for dynamic pages (admin area, logged-in users, form submissions). The key is excluding dynamic pages from caching while serving static content instantly.
Important: Always include standard bypass rules for wp-admin, logged-in users, and e-commerce pages (even if you don’t currently use e-commerce) – these are best-practice safety rules that prevent caching issues.
Do I need all three caching layers?
Not necessarily. The three layers provide different benefits:
PHP OpCache (free, automatic) – Start here, provides 50-95% improvement
Redis Object Cache (easy to add) – Eliminates database bottlenecks
nginx FastCGI Cache (most complex) – Provides the biggest speed boost but requires server access
For shared hosting, use WP Rocket or similar plugins. For VPS/dedicated servers, all three layers are highly recommended.
Disclaimer: Results may vary based on your server configuration, hosting provider, traffic patterns, and geographic location. The 40ms TTFB mentioned represents best-case performance for cached pages in the same region as the server. Always test optimizations in a staging environment before deploying to production.
Start your experience with Mazdora


